
When the Correction Becomes the Problem
Cross-national scale bias, mean-centering, and why ipsatization is the wrong fix for segmentation
A Problem That Lives in Every Global Study
Anyone who has run a segmentation study across multiple markets has encountered a version of this problem, even if they did not have a name for it. Brazilian respondents cluster differently from German ones, South Korean data looks nothing like French data, and the question that lingers after the debrief is always the same: are these real differences in attitudes, values, and behavior, or are they artifacts of how people in different cultures use rating scales?
The answer, more often than we acknowledge, is both. Real attitudinal differences exist across markets, and they deserve to be found. But layered on top of them is something more mechanical — a systematic difference in how respondents engage with the scale itself. Some cultures gravitate toward the extremes. Others cluster in the middle. Some populations agree readily, regardless of the specific content of the statement. These tendencies are so stable and so consistent that they have their own names in the measurement literature: extreme response style, central tendency bias, and acquiescence bias. Together, they fall under the umbrella of cross-national scale usage bias, and they represent one of the more stubborn methodological challenges in international survey research.
The problem is not that these response tendencies exist. The problem is what happens when analysts try to correct for them in ways that are technically appealing but analytically damaging — and nowhere is this more consequential than in segmentation.
The Intuitive Fix and Why It Fails
Ipsatization — the practice of subtracting each respondent's mean score across all items so that their personal average becomes zero — is a long-standing method for dealing with response style differences. The logic is straightforward: if we remove each person's general tendency to score high or low, what remains is a profile of relative preferences, uncontaminated by scale usage idiosyncrasies. It sounds like exactly the kind of principled correction that rigorous analysis demands.
It is the wrong tool for segmentation. Not in some cases, not under certain conditions — categorically, structurally, and mathematically wrong, for any segmentation study using standard Likert-type rating scales.
To understand why, it helps to think geometrically. Each respondent in a study can be represented as a point in space, where each dimension corresponds to one survey item and the respondent's position on that dimension reflects their score. In that space, clusters are groups of respondents who are close to one another — similar in how they rated the items, whether that similarity reflects their level of enthusiasm, their degree of agreement, or their overall pattern of priorities. Both the direction a respondent sits in (their relative profile across items) and their distance from the origin (their overall level of response) carry meaningful information.
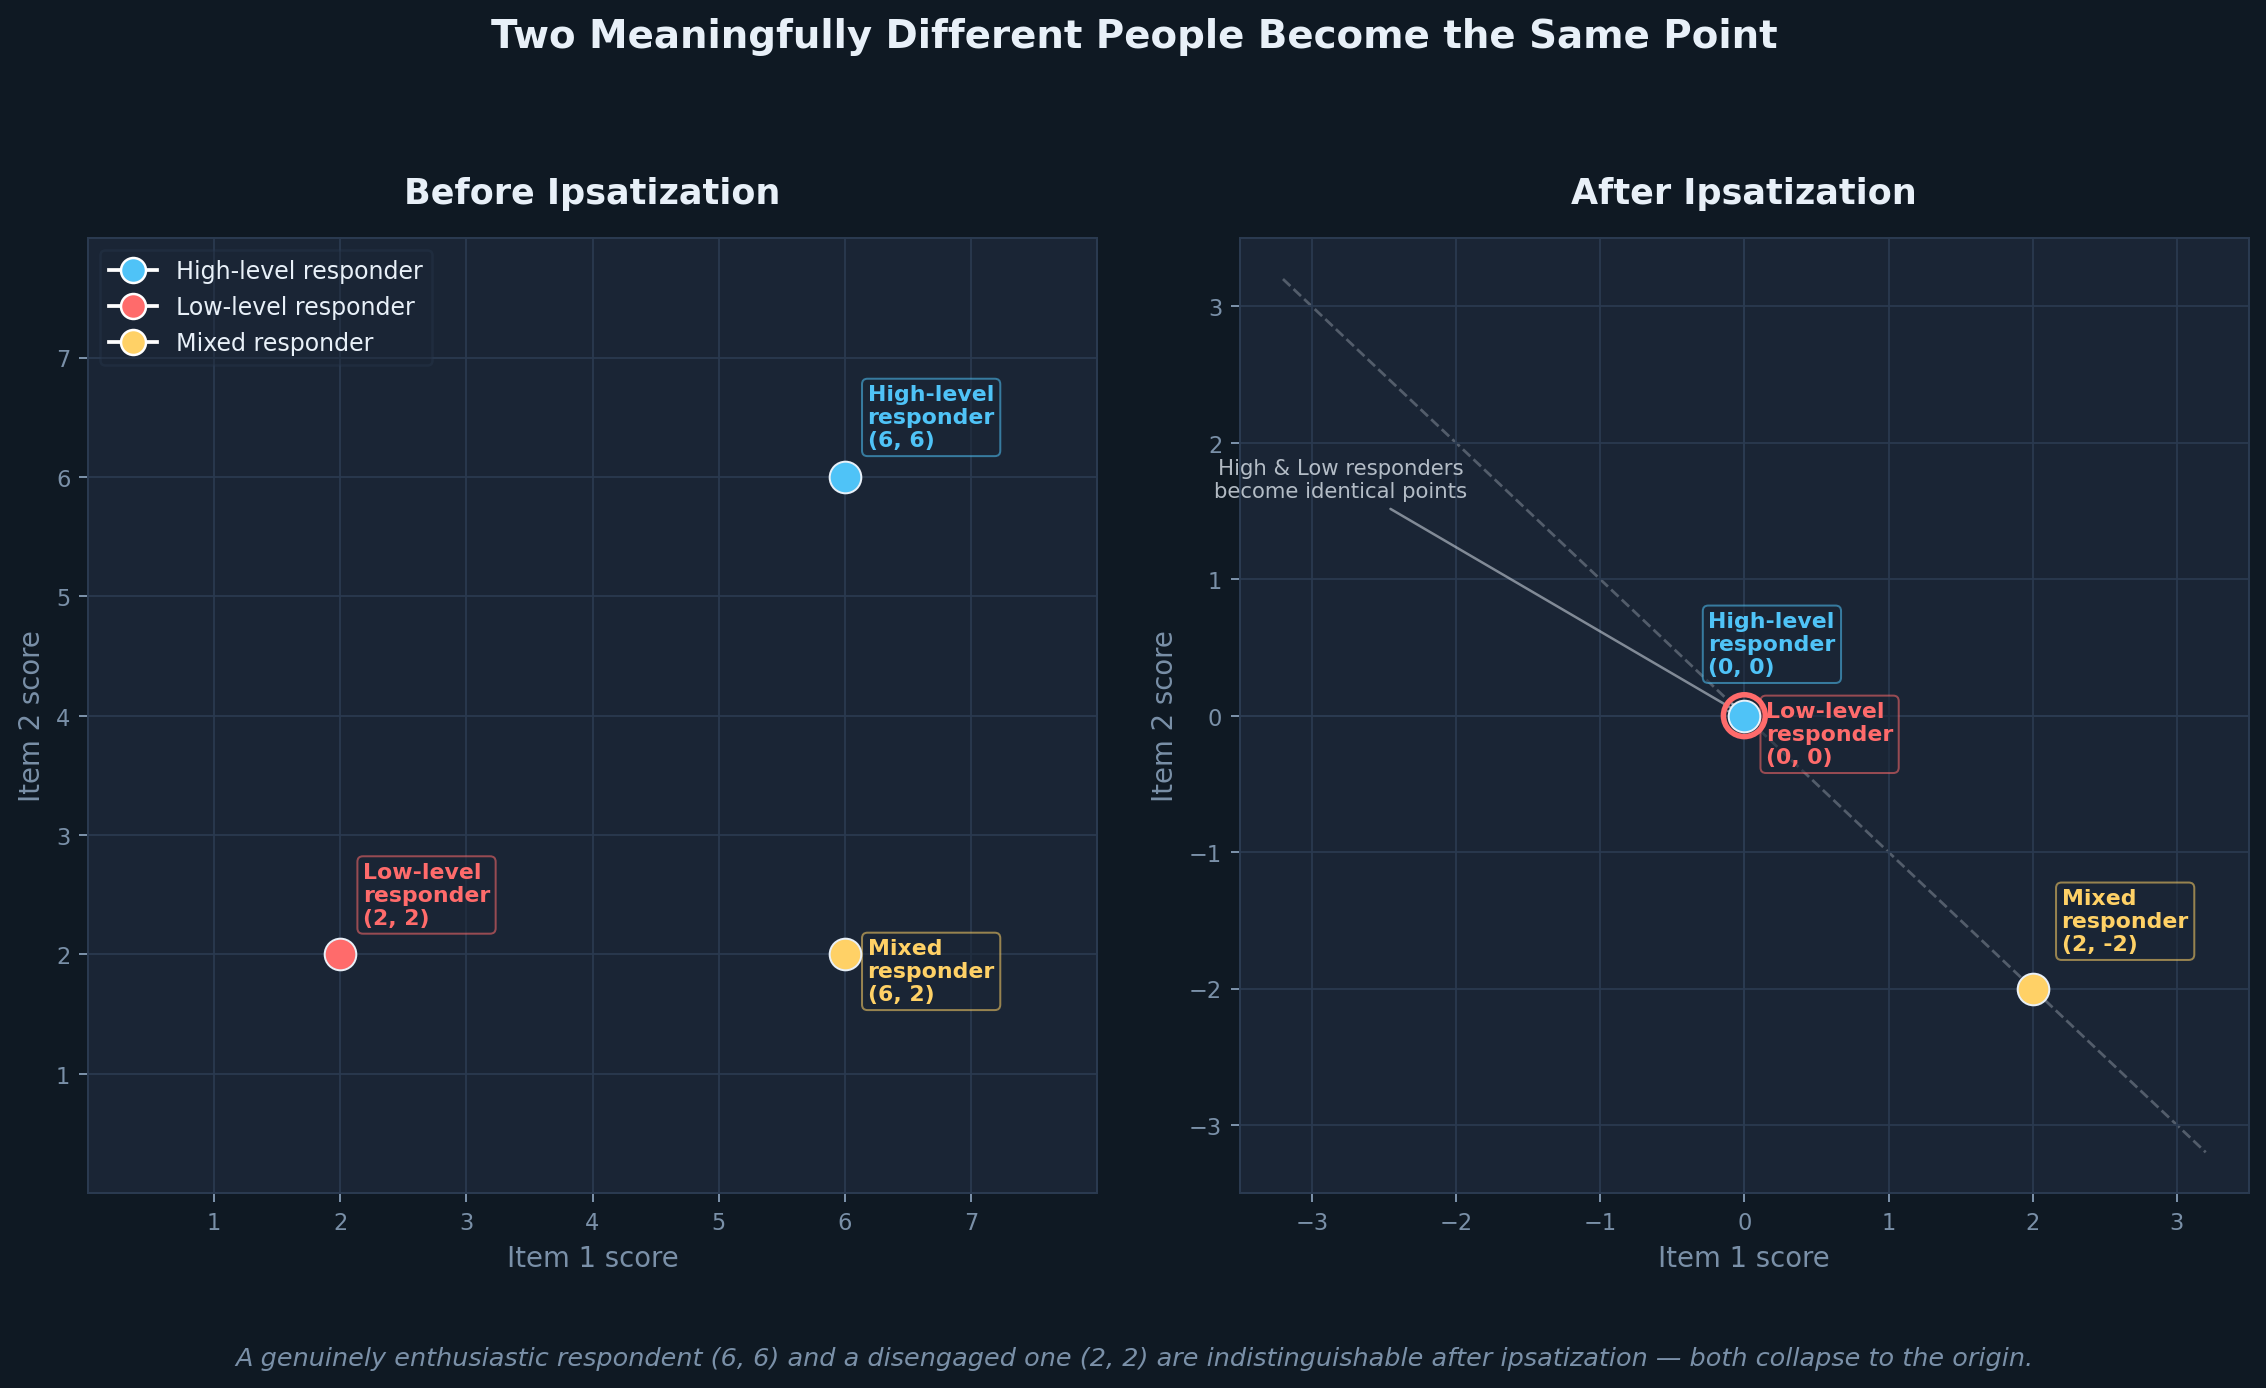
Ipsatization strips away the level dimension entirely. When you subtract each respondent's mean from all of their scores, every point in the dataset gets projected onto a lower-dimensional surface — a hyperplane in which all coordinates sum to zero. In the simplest possible case, two items and three respondents, the geometry is stark: a person who rated everything at 6 out of 7 and a person who rated everything at 2 out of 7 both collapse to exactly the same point at the origin. They are, in the ipsatized space, identical. And a data cloud that previously showed well-separated clusters differing in both profile shape and overall response level is flattened onto a single line, where the only remaining variation is which items a respondent rated higher relative to their own average.
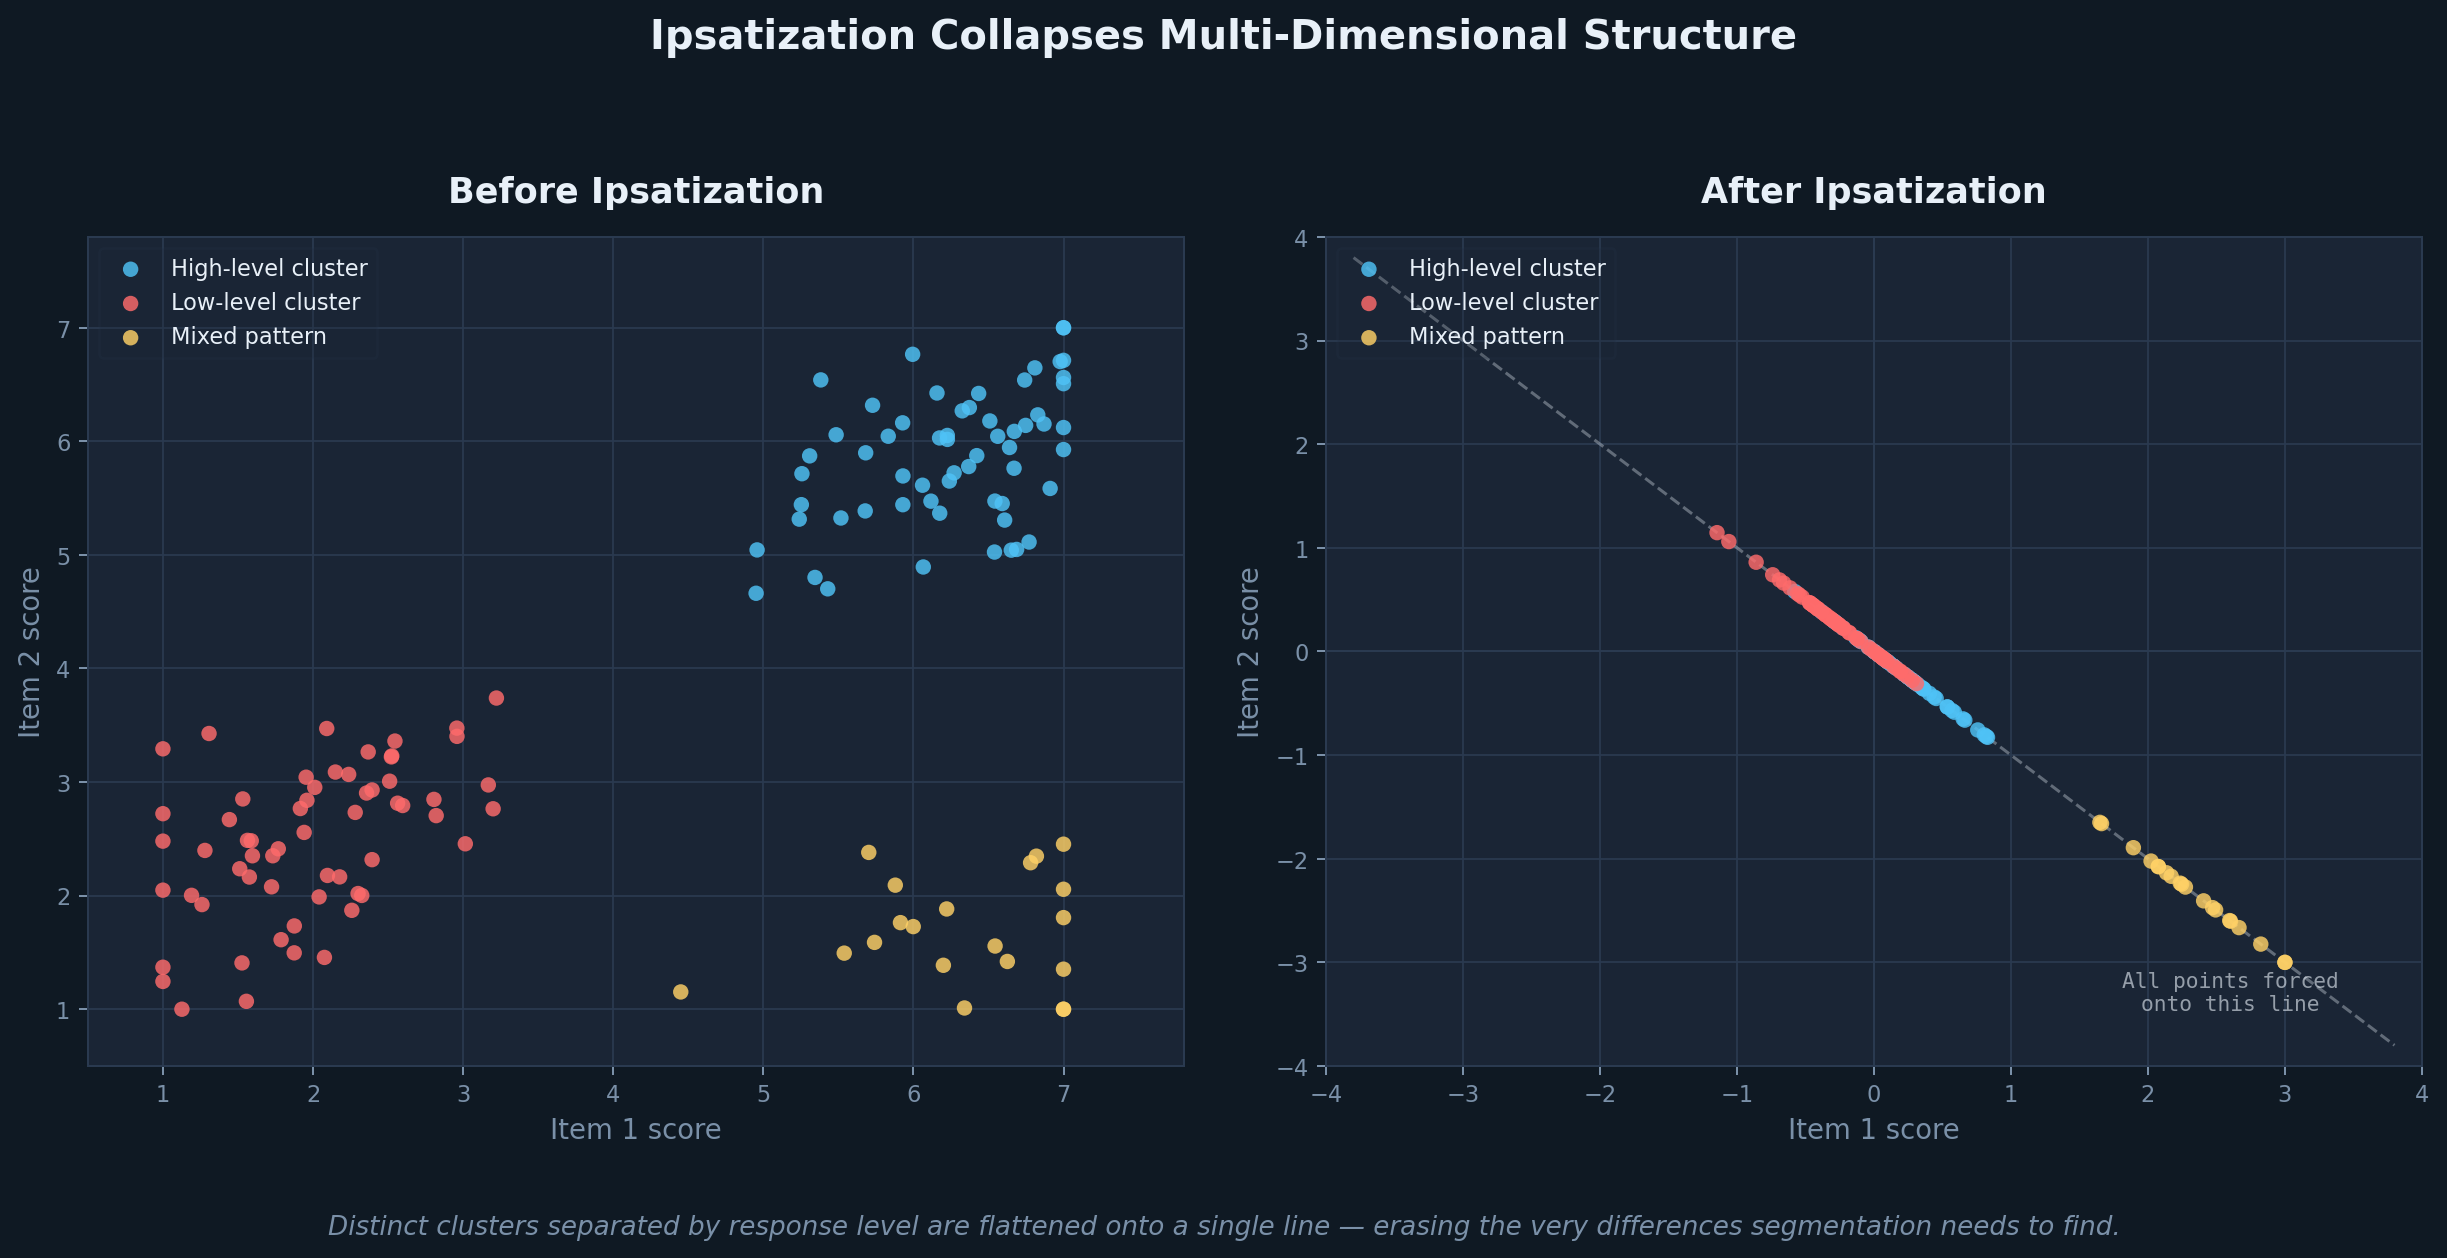
Flattening of points in space
Loss of distinct clusters
The two graphics accompanying this article illustrate this directly. The first shows what happens to a realistic respondent cloud before and after ipsatization — distinct clusters with meaningful separation collapsing into a single constrained axis. The second makes the human cost of that collapse concrete: a genuinely enthusiastic respondent and a genuinely disengaged one become the same point. That is not a correction. That is the erasure of a real and diagnostically important difference.
Why This Matters for Segmentation Specifically
Distance-based clustering methods — k-means, hierarchical clustering, Ward's method — depend entirely on the geometry of the respondent space. They are looking for groups of points that are close to one another and far from other groups, which means they rely on centroid locations, inter-point distances, and the ratio of within-cluster to between-cluster variance. Ipsatization degrades all three, because it shrinks the distances between points that were meaningfully far apart, collapses distinct respondent types into the same location, and injects artificial negative correlations into the data that distort the covariance structure the algorithms are trying to exploit.
The consequences in practice are clusters that look superficially clean but carry little diagnostic power — unstable solutions that shift with minor changes in sample composition, segments that prove difficult to profile or name because the level differences that would have defined them have been removed, and predictive validity that disappoints when the segmentation is applied to behavioral or commercial outcomes.
Latent methods — latent class analysis and latent profile analysis — are architecturally more resilient to scale usage bias, and this is one of their most underappreciated advantages in cross-national work. Rather than computing distances between raw scores, these models estimate the probability that a respondent belongs to a latent class based on the conditional pattern of their responses given class membership. A respondent who rates everything at 6 and one who rates the same relative pattern at 4 can still be assigned to the same class, because the model is looking for pattern consistency, not raw score similarity. This does not mean latent methods are immune to scale bias — extreme systematic differences across markets can still influence class structure — but they are considerably less sensitive to it than distance-based approaches, and in a cross-national context that robustness matters.
What You Can Actually Do About It
For analysts working with distance-based methods in a commercial environment, the most practical and defensible adjustment is within-country z-scoring before pooling. Standardizing scores within each market preserves the between-person differences that segmentation depends on, while removing the systematic country-level differences in mean and variance that reflect scale usage rather than attitude. It is a single transformation step, implementable in any standard analysis tool, and its logic is transparent enough to explain to a client or a research director without a methodology appendix.
A second option, better suited to studies where the questionnaire design can be controlled upfront, is anchor-item centering — choosing one or two stable reference items and centering relative to those rather than across all items. This avoids the geometric collapse problem because you are not forcing all coordinates to sum to zero; you are adjusting relative to a fixed external reference. It requires more deliberate questionnaire construction but introduces far less distortion than full ipsatization.
There are more rigorous solutions in the academic literature — anchoring vignettes, item response theory models that explicitly estimate response style as a latent parameter, multilevel models that treat country-level scale usage as a random effect. These approaches are well-validated and, in the right research context, genuinely superior. They also require either substantial additional questionnaire real estate, dedicated statistical infrastructure, or both, which puts them outside the scope of most commercial segmentation projects. They are worth knowing about if you are designing a large-scale tracking study or have a methodology team with the appetite for it.
The Principle Underneath the Method
Cross-national scale bias is real, and the instinct to correct for it is sound. But the correction has to preserve the information that the analysis needs, and ipsatization does not meet that standard in segmentation. It removes the very between-person differences — in engagement level, in intensity of preference, in overall enthusiasm — that give segments their meaning and their commercial utility.
A seven in Brazil and a seven in Germany may not carry the same absolute weight, and accounting for that is legitimate and necessary. But a six and a two within the same market, from the same respondent pool, represent a real and interpretable difference that no correction should erase. When the fix destroys more signal than the bias it was meant to remove, it is time to reach for a different tool.